

Open, transparent security is a foundational part of the Sublime story. Because of this, we’re excited to announce a new partnership with a company that shares that same spirit of openness: Elastic. With this new integration, teams can now ingest Sublime email security data into Elastic, as well as monitor their Sublime instance.
Elastic helped pioneer the idea of open detection rules in an industry that has traditionally leaned heavily towards black boxes. At Sublime, we do the same.
Ingesting and analyzing Sublime email data with Elastic
With this new Elastic Agent integration, Sublime data can be ingested directly into Elastic to paint a more holistic security picture and enhance security operations. The integration brings in two streams of email security data for use with Elastic:
- Message Event: All messages flagged by active Sublime detection rules
- Email Message: All Message Data Models (MDMs) processed by Sublime
The integration will also automatically add three new Sublime Security dashboards to Kibana: two that feature visualizations, and one for observability that we’ll look at later in this post.
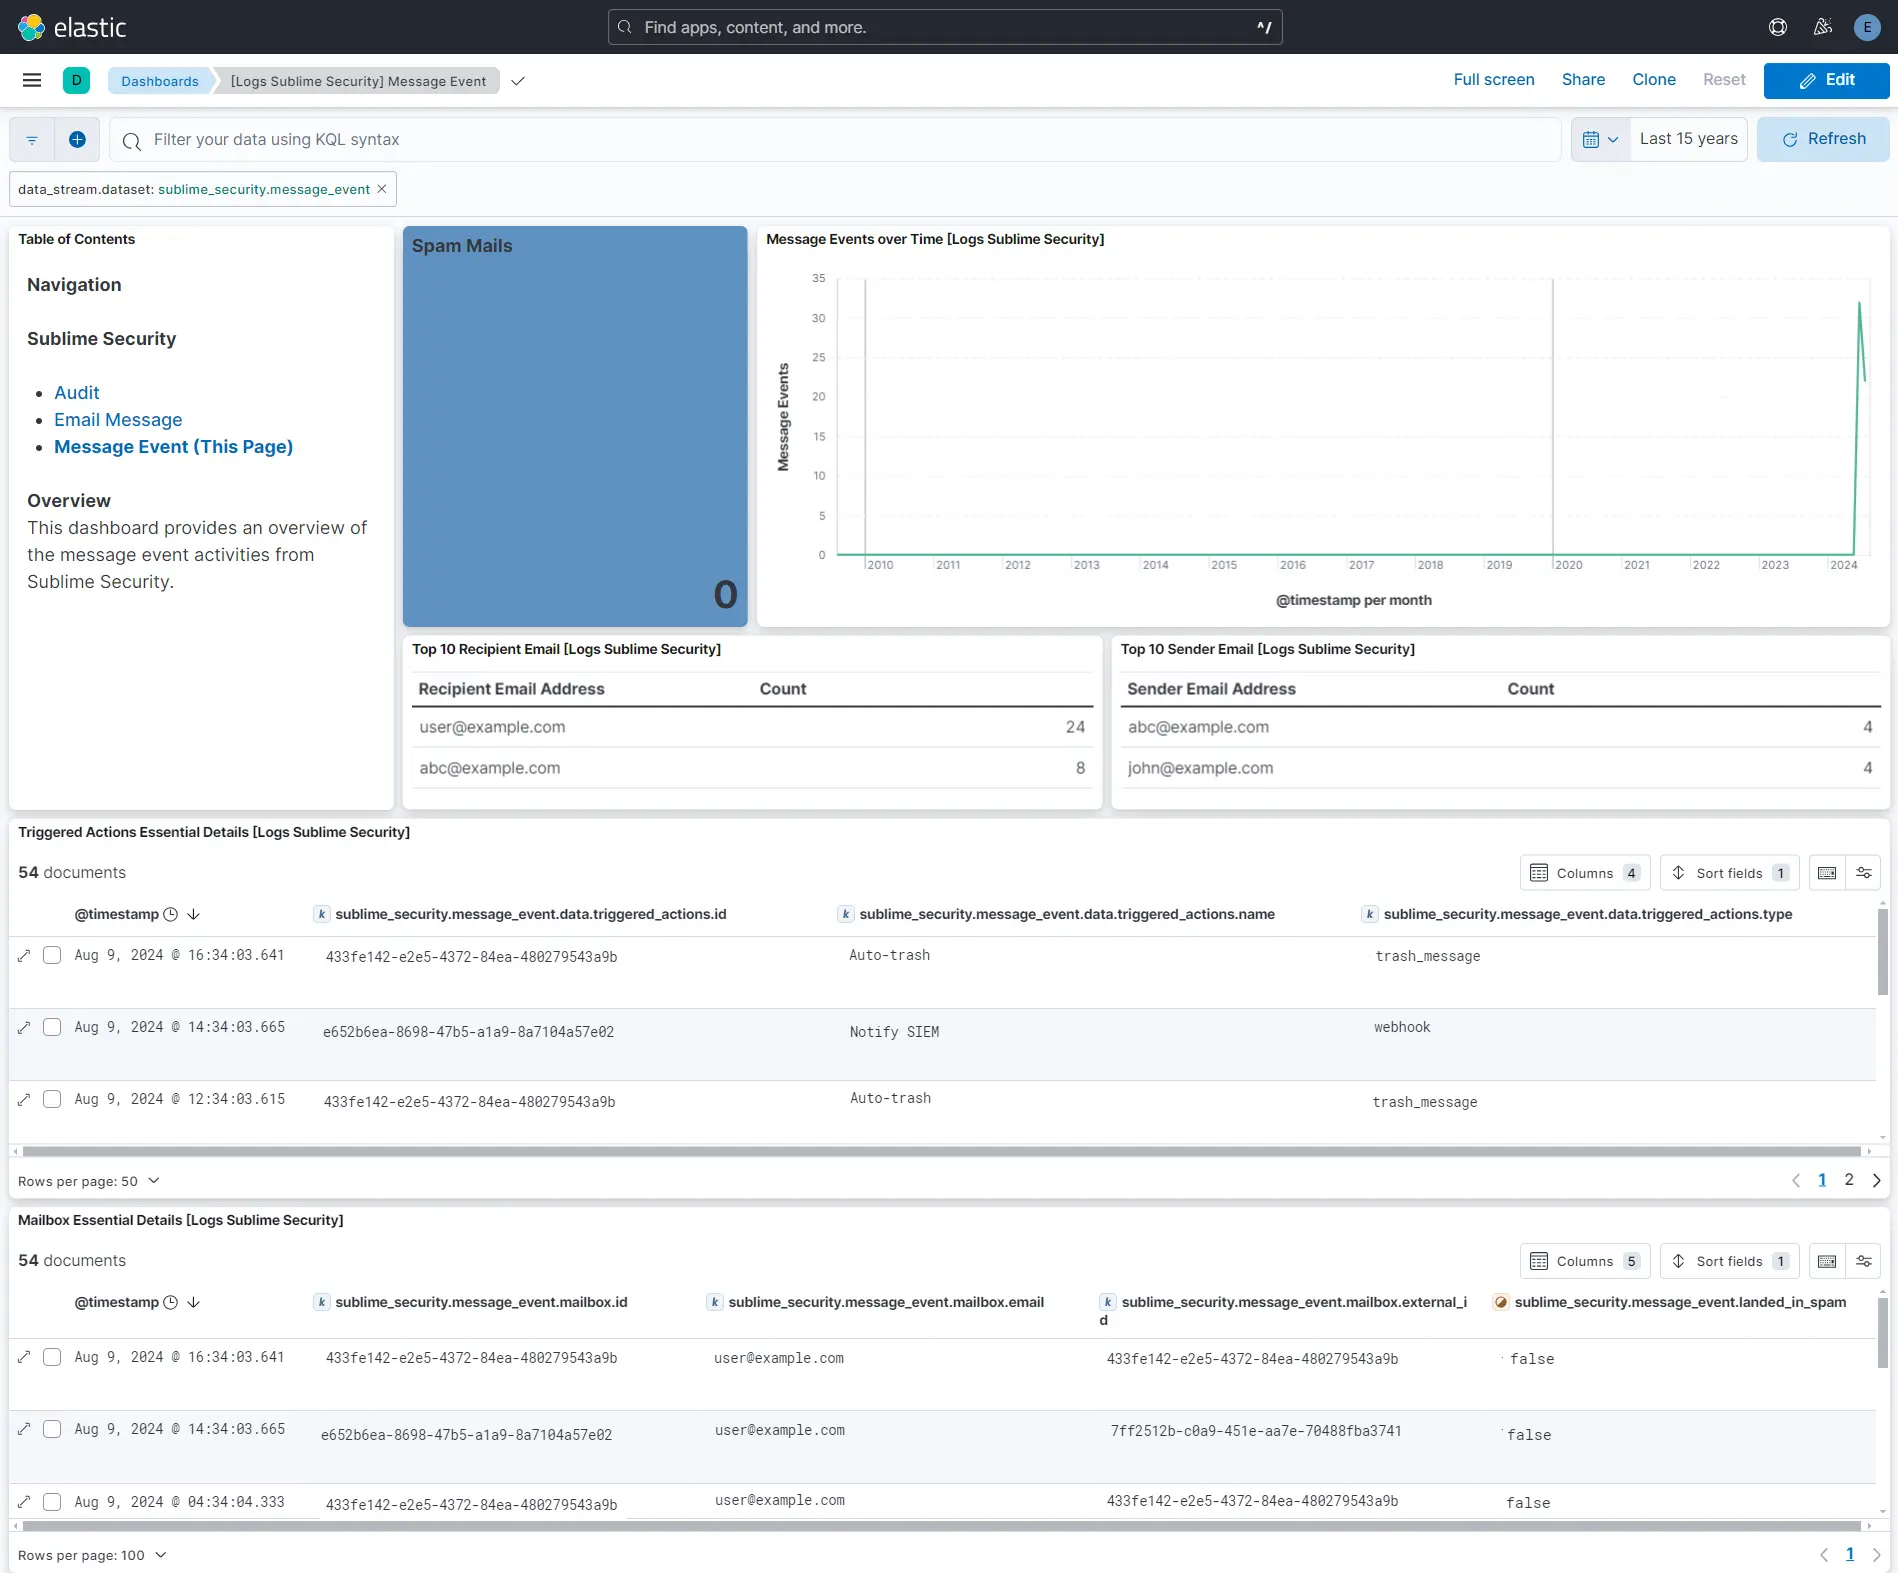
Security teams aren’t limited to the default dashboards. Sublime visualizations can be added to existing dashboards, creating a unified source of security truth. Aside from dashboards and visualizations, Sublime data can also be used to create alerts, just like any other security data already ingested into Elastic.
Enriching Sublime data in Elastic
Sublime data can be enriched during or after ingest to Elastic, increasing its value for teams. As an example, here is a simple two-step ingest enrichment to correlate Google Workspace data:
Step 1: Create an enrichment policy
Step 2: Create a custom enrichment pipeline that calls the policy
The enrichment pipeline can then be used within different data streams for custom alerting, automation, reporting, and more. This type of enrichment can be created for any systems that have data that can be correlated with Sublime. This can include anything from collaboration (Slack, Teams, etc.) to endpoint information (OU, machine status, etc.).
Correlating security data with EQL
While dashboards are a great way to visualize massive quantities of data, we're even more excited about the ability to easily correlate email data with other data ingested into Elastic. Using Elastic’s Event Query Language (EQL) – which is similar to Sublime’s Message Query Language (MQL) in many ways – analysts can write simple queries to hunt for threats and correlate with all of their security data – email, endpoint, cloud, and more.
Here are just a few use cases:
- If a user's endpoint or credentials are compromised, analysts can see if the user had any Detection Rules fire in their mailbox as well as what actions (if any) were taken.
- If malware is detected on an endpoint, analysts can correlate the file hash with email attachment file hashes to determine if it was email-originating.
- If a user visits a malicious site, analysts can correlate network telemetry with URLs or domains within email messages to determine if it was email-originating.
Monitoring Sublime
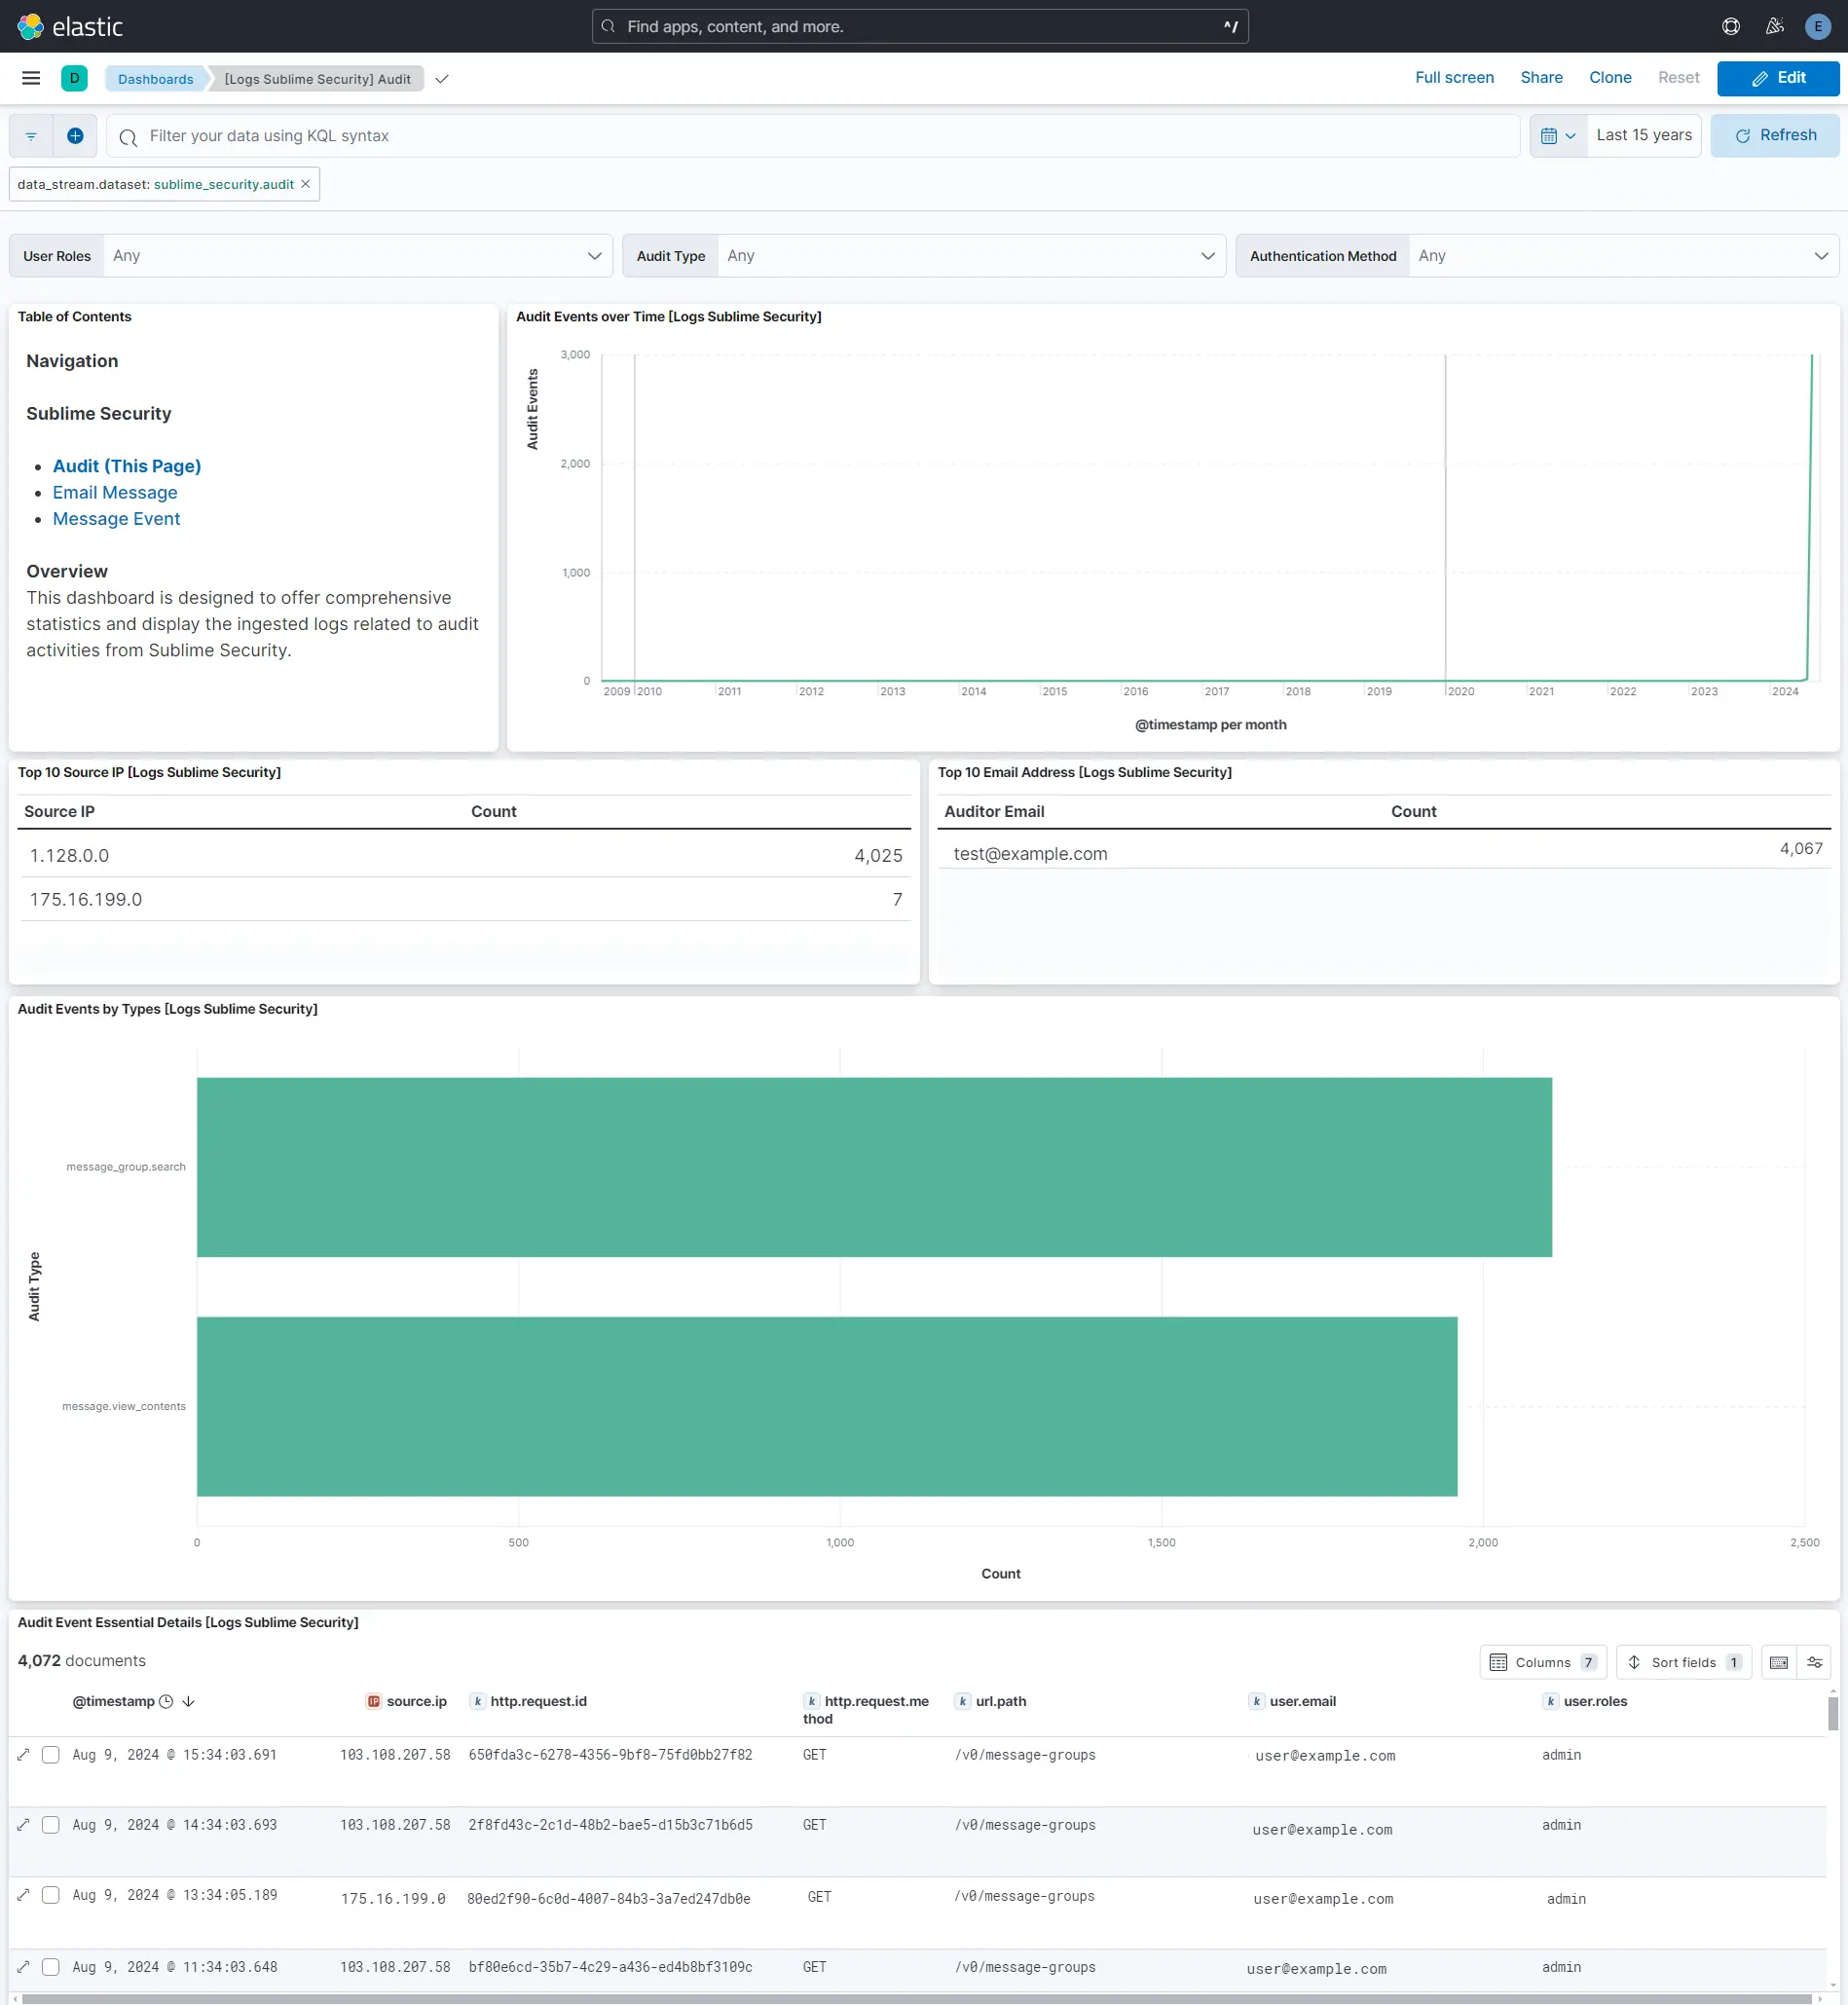
The integration also creates an Audit data stream to bring Sublime data into Elastic. Sublime's audit log captures detailed records of all significant configuration changes in your Sublime account, including message views and justifications submitted, detection rule modifications, users added/removed, and more.
Just like with the Email Message and Message Event data streams, you'll get a default Audit dashboard out-of-the-box, with the ability to add to existing dashboards and create custom alerts.
Sublime + Elastic for holistic, observable security
With this new integration, you can make Sublime a key part of your Elastic deployment, correlating email security data with all of your other existing security data. On top of that, you can easily monitor changes to your Sublime deployment too.
If you’re not already using Sublime for email security, start your free account today, managed or self-managed, for protection against the full spectrum of email attacks including business email compromise, callback phishing, and much more.
If you’re already using Elastic for security and observability, integrate Sublime today. If you’re not, but you’re curious how Elastic can boost the value you get from your Sublime deployment, sign up for a free trial of Elastic Cloud today.
Get the latest
Sublime releases, detections, blogs, events, and more directly to your inbox.
.svg)


.avif)
